![]() We’re accountants! So obviously we need our reliable documentation to support our conclusions. Whether you are on the fence about becoming a CPA or have already started studying, here are some useful facts and statistics to help shed some light on what you (and all other CPA candidates) are up against!
We’re accountants! So obviously we need our reliable documentation to support our conclusions. Whether you are on the fence about becoming a CPA or have already started studying, here are some useful facts and statistics to help shed some light on what you (and all other CPA candidates) are up against!
See the Top CPA Review Courses
- 1. Becker CPA Review Course ◄◄ Endorsed by Big 4 Accounting Firms + Save $1,330
- 2. Surgent CPA Prep Course ◄◄ Best Adaptive Technology
- 3. Gleim CPA Study Materials ◄◄ Largest CPA Test Bank
CPA Exam Testing Windows
Previous, every third month of the quarter is a blackout month when the Uniform CPA Examination cannot be taken. However, a lot has changed due to recent global events, so these policies have changed. Thanks to NASBA’s new position on Continuous Testing, here are the new exam testing windows for the year 2024:
| Window | Testing Windows | Blackout Month | |
| 1 | January | February | March |
| 2 | April | June | None |
| 3 | July | December | None |
Target CPA Exam Score Release Dates
| Day in Testing Window | Target Release Timeline |
| Day 1 – 20 | 11 business days following day 20 of the testing window |
| Day 21 – 45 | 6 business days following day of the testing window |
| Day 46 – Close of window | 6 business days following the close of the testing window |
| After close of window | 6 business days after receiving all scoring data for the testing window |
Learn More About The CPA Exam
[uam_ad id=”7978″]
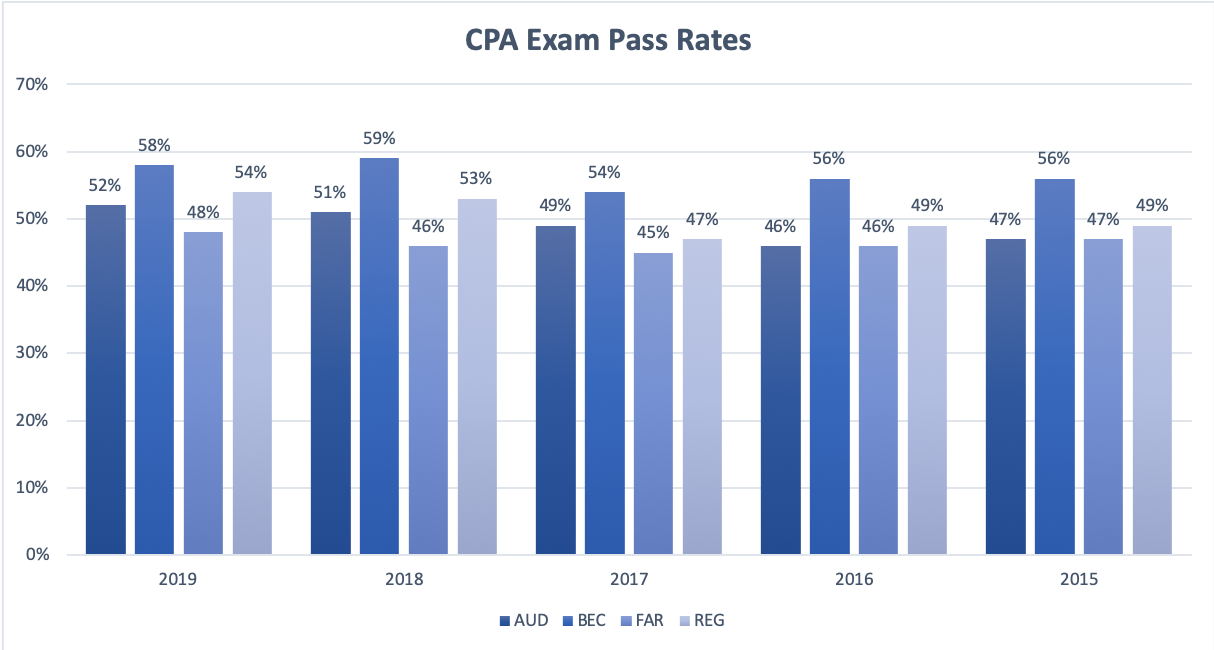
CPA Pass Rates by Section
CPA exam pass rate percentages can be taken in a few ways. Hence, you should take the following statistics with a grain of salt. Worried about passing? It’s possible! You failed? You’re not alone! Either way, all four sections of the CPA exam are hard, but you can beat them! The passing score stats below are for the 2016 CPA exam, covering Auditing and Attestation (AUD), Business Environment and Concepts (BEC), Financial Accounting and Reporting (FAR), and Regulation (REG):
| Section | Q1 | Q2 | Q3 | Q4 |
| AUD | 49% | 55% | 52% | 48% |
| BEC | 58% | 60% | 63% | 59% |
| FAR | 44% | 49% | 50% | 41% |
| REG | 50% | 59% | 58% | 56% |
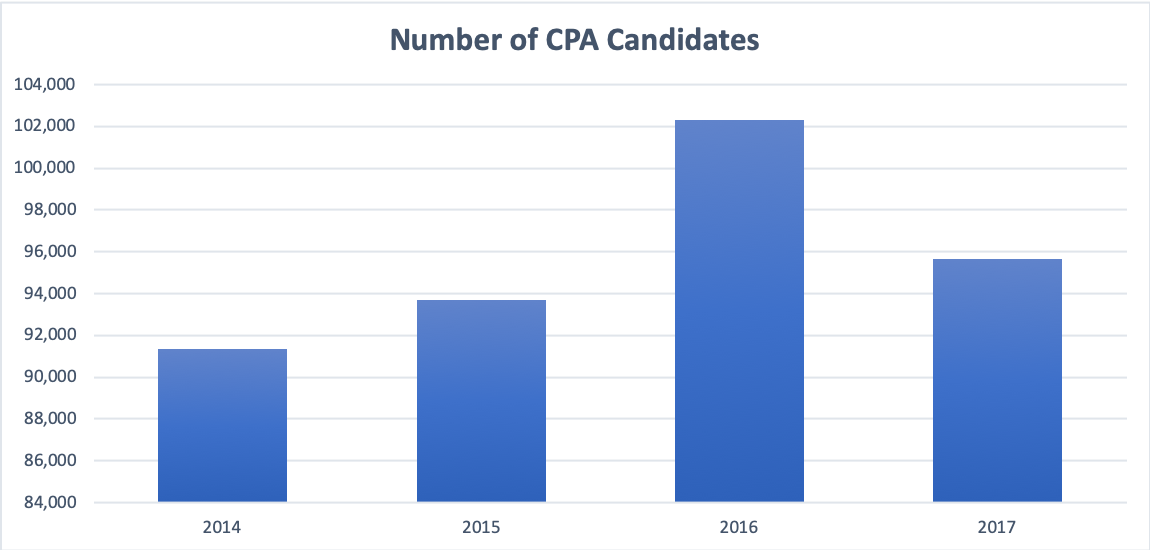
Number of CPA Exam Candidates
Pass Rates by CPA Exam Section
Get Discounts On CPA Review Courses!
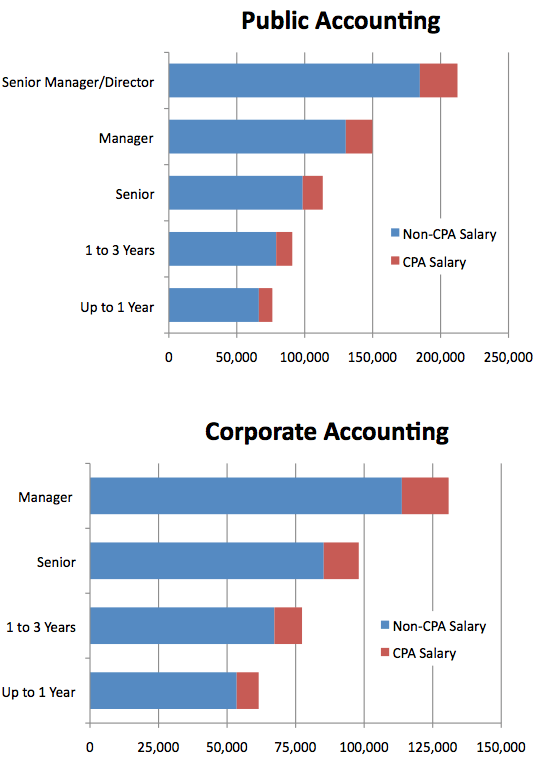
Salary Range of Accountants and CPAs
Below are salary ranges derived from the 2013 Robert Half Salary Guide by experience level that can be reached for both public and corporate accounting. Certified Public Accountants tend to make 10 – 15% more than financial accounting professionals without a CPA license. Furthermore, CPA salaries on each chart reflect a 15% increase over non-CPAs.
Demand for Accountants and CPAs
We’re always in demand! Accountants are needed anywhere and everywhere even in a weakened economy. An accountant with a CPA is more distinguished than another candidate with the same qualifications without a CPA. On top of the demand for public accounting, an accountant with a CPA is just that much more sought after.
Per the Bureau of Labor Statistics, the accounting profession is expected to grow 11% from 2014 to 2024. Employment for accountants and auditors in 2014 was 1,332,700 while projected employment in 2024 is expected to increase to 1,475,100.
Accountants and auditors have been ranked #5 as the best jobs of the future according to Business Insider. This takes into consideration both salaries and projected growth in the coming years.